
 Add to Preferred Sources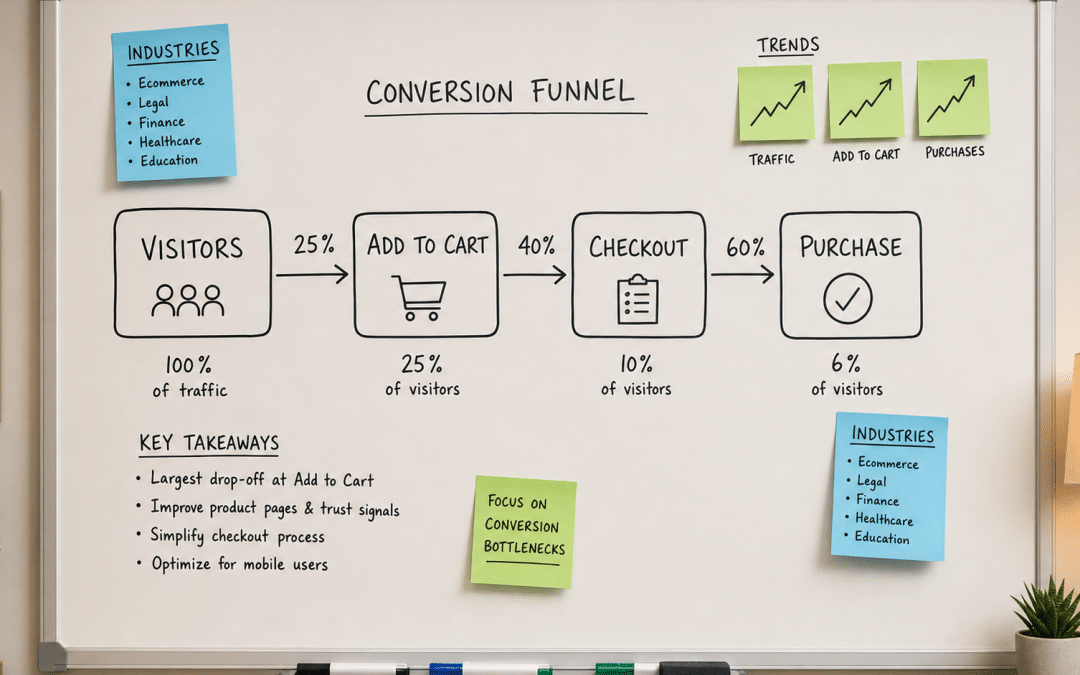
Conversion rate benchmarks south africa vary dramatically by sector — from as low as 0.94% for luxury ecommerce to 7.9% for legal and automotive — and South African websites typically sit at the lower end of every range. Understanding where your site stands against real industry data is the first step in any effective CRO strategy. Without a sector-appropriate yardstick, you cannot tell the difference between a site that needs urgent optimisation and one that is performing exactly as its category allows.
South African ecommerce stores averaged around 1.5% purchase conversion in 2024, according to data compiled by ECDB — roughly level with the global ecommerce average of 1.6% tracked by Statista for Q3 2025, but well below what higher-intent sectors like professional services and legal achieve. If you have ever wondered what conversion rate optimisation actually moves, the answer starts with knowing which benchmark applies to you.
Quick Answer
Conversion rate benchmarks south africa differ by industry: SA ecommerce averages around 1.5% for purchases, while professional services and legal track 6.1–7.9% for lead-based conversions globally. SA cart abandonment runs at 83–84%, notably higher than the global average of 70%. Your rate is only meaningful against your sector — comparing an online furniture store to a law firm's enquiry form is comparing different markets entirely.
Jump To
Not sure how your conversion rate compares to your sector? Get a CRO assessment — we benchmark your site against relevant SA and global data before touching a single element.
What Do Conversion Rate Benchmarks Actually Measure?
A conversion rate benchmark is a reference figure that tells you what percentage of website visitors a typical site in your sector converts into a desired outcome — but that outcome is not the same across all sources. This distinction matters before you read any table in this post.
Purchase conversions (ecommerce) count visitors who complete a transaction — on a store converting at the global benchmark of 1.6%, that is roughly 1–2 buyers per 100 visitors. Lead conversions (professional services, B2B, real estate) count visitors who submit a contact form, request a quote, or book a call. These are fundamentally different actions with different friction levels — which is why legal firms and software vendors show wildly different benchmark numbers even when serving similarly sized audiences.
Why Benchmarks Diverge Between Sources
Different research firms measure different things. Ruler Analytics tracks 110 million sessions across 13 industries and counts form submissions and calls as conversions. Shopify tracks store purchases. Baymard Institute analyses cart abandonment specifically. When you see a 5% "conversion rate" for finance and a 1.5% rate for ecommerce, you are almost certainly looking at different event types — not a meaningful performance gap between the industries.
Conversion Rate Benchmarks by Industry
The conversion rate benchmarks South Africa businesses use as starting points come from a set of global studies — none of which measured SA exclusively, but all of which offer directionally valid reference data. The table below draws on Ruler Analytics' 2026 dataset (110 million sessions, 5 million conversions tracked) and covers lead-based conversions — form submissions, phone calls, and booked appointments — not ecommerce purchases. These are global figures; SA-specific ecommerce data is in the next section.
| Industry | Average CR (Global, 2026) | Best For |
|---|---|---|
| Legal Services | 7.9% | High-intent searchers with an urgent, specific problem |
| Automotive | 7.9% | Test-drive and dealer enquiry pages with local targeting |
| Software (B2B) | 7.6% | Free trial and demo request pages |
| Education | 6.3% | Course enquiry forms with clear programme information |
| Finance | 6.3% | Quote requests and calculator-based landing pages |
| Marketing & Advertising | 6.2% | Audit and proposal request pages |
| Professional Services | 6.1% | Consultation request forms on targeted pages |
| Construction & Engineering | 4.9% | Project quote requests with portfolio evidence |
| Beauty & Cosmetic | 3.5% | Booking pages and loyalty programme sign-ups |
| Real Estate | 2.8% | Property enquiry forms with virtual tour or gallery |
| Health & Social Care | 2.3% | Appointment request pages with trust indicators |
| Retail & eCommerce | 2.4% | Product pages with strong social proof and clear delivery |
| Travel | 1.9% | Package enquiry forms; booking confirmation flows |
Source: Ruler Analytics 2026 — 110M+ sessions, 5M+ conversions across 13 industries. Figures reflect lead-based conversions (forms, calls, appointments) — not ecommerce purchases.
Key Insight From the Table
Legal, automotive, and software see the highest conversion rates because traffic arriving at those pages already has high intent — the visitor knows they have a problem and is actively looking for a solution. Travel and ecommerce battle lower intent: browsers frequently visit multiple times before committing. If your site is in a low-intent category, a 1.9–2.4% rate is not a failure — it is the market.
South African Ecommerce Conversion Rate Data
South African ecommerce purchase conversions averaged around 1.5% in 2024, tracking broadly alongside the global ecommerce average of 1.6% recorded by Statista for Q3 2025. The closer look at the funnel tells a harder story.
| Metric | South Africa (2024) | Global Average |
|---|---|---|
| Ecommerce purchase conversion rate | ~1.5% | 1.6% (Statista Q3 2025) |
| Add-to-cart rate | 9.4–10% | Comparable to SA |
| Cart abandonment rate | 83.5–84.5% | 70.22% (Baymard, 50-study avg) |
SA data: ECDB/ecommercedb.com (2024–2025). Global cart abandonment: Baymard Institute (average of 50 published studies).
The gap that matters most is cart abandonment: SA shoppers abandon at 83–84%, roughly 13 percentage points above the global average of 70%. This means SA add-to-cart rates are competitive — the problem is not product interest, it is what happens at checkout. Payment friction, trust gaps, and shipping cost surprises drive most of that abandonment. Read the full SA cart abandonment analysis for a breakdown of exactly where sessions are being lost.
Within ecommerce, category affects your SA benchmark significantly. Global data from Shopify (Q3 2025) shows food and beverage converting at 6.22%, beauty and personal care at 4.94%, fashion at 3.06%, home and furniture at 1.41%, and luxury and jewellery at 0.94%. SA stores in considered-purchase categories (furniture, electronics, luxury goods) should expect to sit at or below the lower end of those ranges without deliberate ecommerce CRO work.
SA Ecommerce Insight
South African online retail is growing fast — R96 billion in 2024 (35% year-on-year growth) with projections exceeding R130 billion in 2025, according to World Wide Worx. The market opportunity is real, but conversion rates are not keeping pace with traffic growth. Stores that close the checkout gap will capture disproportionate share as the market matures.
Conversion Rates by Marketing Channel
Where your traffic comes from shapes your conversion rate before your page does anything. Paid search visitors have already signalled intent by typing a query; social media visitors arrive from a scroll. These are different audiences with different readiness to act.
| Channel | Average CR (Global, 2026) | SA Relevance |
|---|---|---|
| AI Referral (ChatGPT, Perplexity, Gemini) | 5.8% | Emerging — early-mover advantage for SA sites cited in AI answers |
| Paid Search (Google Ads) | 5.4% | High — intent-led SA traffic converts above most organic sources |
| Email Marketing | 4.9% | High — warm list with prior relationship; strong for SA loyalty plays |
| Organic Search (SEO) | 4.9% | High — trust signal; often the highest-quality long-cycle visitor |
| Direct Traffic | 4.7% | High — brand-aware visitors with clear intent |
| Referral (other sites) | 4.8% | Medium — depends on source quality and audience match |
| Social Media Organic | 2.23% | Medium — SA social audiences are large but cold for high-ticket items |
| Paid Social (Meta, LinkedIn) | 2.11% | Medium — interruption-based; needs strong offer and fast-loading destination |
Source: Ruler Analytics 2026. AI referral benchmark noted as new for 2026 — SA data not separately compiled. For SA-specific Google Ads figures see Google Ads benchmarks South Africa.
The AI referral finding is worth noting for SA marketers: traffic arriving from tools like ChatGPT or Perplexity converts 22% higher than traditional organic search, according to Digital Applied's 2026 analysis. AI-driven search is still a small slice of SA traffic, but the intent quality is exceptional — visitors who asked an AI a specific question and were directed to your site are already one stage further along the decision path than a typical organic searcher.
Mobile vs Desktop Conversion in South Africa
Mobile dominates South African web traffic, and it is the single biggest structural conversion challenge local sites face. As of July 2026, mobile accounts for 58.13% of web sessions in South Africa, according to Statcounter — and over 77% of South Africans who shop online do so from a mobile device, according to World Wide Worx data.
The conversion problem is not the device — it is the combination of mobile screen size, variable data speeds, and checkout friction. Globally, mobile converts at roughly 1.82% versus desktop at 3.14%. That gap widens in South Africa because a significant portion of mobile traffic arrives on cellular connections with inconsistent speeds, where page load times directly suppress conversion rates.
Page Speed and Conversion: The Numbers
A Google and Deloitte joint study found that a 0.1-second improvement in page load time increases ecommerce conversions by 8.4% and average order value by 9.2%. Separately, NitroPack's research found 50% more visitors drop off when a page loads in 3 seconds compared to 2 seconds. In South Africa, where a page that loads in 2.5 seconds on Cape Town fibre may load in 8–10 seconds on a Gauteng mobile connection, page speed is not a technical nicety — it is a revenue decision. For a deeper look at this specific issue, see how page speed kills SA sales.
Load-shedding adds a further SA-specific layer: interrupted power cuts mobile sessions mid-browse, and a shopper who reconnects is rarely in the same buying mindset. Stores that run lean, fast-loading pages — prioritising progressive web app design, image compression, and PayFast or Peach Payments native checkout flows — recover more of those interrupted sessions.
Why South African Conversion Rates Run Below Global Averages
South Africa's ecommerce conversion rate tracks the global average, but SA cart abandonment runs 13+ percentage points above it. The gap is not about product quality or price — it is structural, and most of it sits at checkout.
What Drives SA Shoppers to Abandon
- Payment trust anxiety. SA shoppers have a higher fraud awareness threshold than many comparable markets. A checkout that does not display familiar payment logos — PayFast, Ozow, Peach Payments, PayJustNow — creates hesitation that global benchmarks do not capture.
- Limited payment method coverage. SA merchants offering at least three payment options see up to 25% higher checkout conversion, according to local benchmark data. Offering only card payment excludes a meaningful share of the SA market where debit card (58%) and EFT-type payments dominate.
- Surprise shipping costs. Freight rates from The Courier Guy, Aramex, and Dawn Wing are visible to merchants but often hidden from shoppers until checkout. Revealed late, they cause abandonment even when every other trust signal is already in place.
- Mobile checkout friction. SA's mobile-first user base encounters checkout forms optimised for desktop. Multi-step checkout on a 5-inch screen with variable connectivity is a reliable conversion killer.
These are all solvable problems — and solving them moves SA ecommerce conversion rates meaningfully, because the gap is not that shoppers do not want to buy. The add-to-cart rate of 9.4–10% shows they do. The conversion problem is specifically at checkout, which is why checkout optimisation tends to produce the fastest measurable lift for SA stores.
Your sector benchmark is a starting line, not a ceiling. Talk to the GPM CRO team about what moving from your current rate to sector average means in revenue terms for your specific business.
What Are Realistic Conversion Rate Targets for SA Websites?
Realistic targets depend on your sector, traffic source, and where you are starting from. The table below is a working framework — heuristic estimates derived from the global benchmark data presented in this post, adjusted for SA market conditions. They are directional targets, not guarantees or independently measured SA figures.
| Site Type | Global Benchmark Range | SA Context |
|---|---|---|
| Ecommerce (general) | 1.6–2.4% (Statista / Ruler Analytics) | SA average ~1.5%; closing checkout gaps can push toward global average |
| Ecommerce (food & grocery) | 4.9–6.22% (Shopify / OptiMonk data) | High-frequency, low-consideration; SA platforms like Checkers Sixty60 proving the model |
| Ecommerce (luxury/high-ticket) | 0.94–1.5% (Shopify data) | Long consideration cycle; trust signals and financing options move the needle in SA |
| Professional services (lead gen) | 6.1–7.9% (Ruler Analytics) | SA sites on warm targeted traffic can realistically approach the lower end of this global benchmark range with strong CRO |
| B2B SaaS / IT services | 1.1–7.6% depending on page type (First Page Sage / Ruler Analytics) | Demo/trial pages convert higher; generic contact pages sit at the low end |
| Real estate enquiry | 2.7–2.8% (First Page Sage / Ruler Analytics) | SA property enquiry pages with virtual tours and pre-qualification forms approach this range |
These ranges are working targets, not guarantees. The fastest path toward global benchmark levels is almost always fixing checkout and trust signals before testing creative or copy — because no amount of A/B testing on headlines moves a rate that is bleeding at payment step. See trust signals for SA buyers for the specific elements that move SA conversion rates most.
For B2B sites, form optimisation and landing page structure are the highest-leverage levers. A well-structured enquiry form on a B2B professional services page routinely converts above the channel average — because your competitors are often still running generic contact pages.
Why South African Businesses Choose Growth Pulse Media for CRO
Growth Pulse Media's CRO work starts with the data, not with gut feel or industry trend pieces. Before touching a single element of a client's site, we establish a proper baseline — current conversion rate by channel, by device, by landing page — and map it against the sector benchmarks that actually apply to that business. A fashion store should not be held to a legal services benchmark; a B2B IT services firm should not be compared to an FMCG checkout flow.
Dirk built and operated a South African ecommerce business before founding GPM. That experience with PayFast settlement cycles, Aramex and The Courier Guy integration, mobile-first SA shoppers, and the trust dynamics of a market where card fraud awareness is high, shapes how GPM approaches conversion rate optimisation for South African businesses. We do not apply global playbooks wholesale — we adapt them to the market where your customers are actually operating.
GPM works with a limited number of clients at any time to ensure senior attention on every account. If you run an established SA business with real traffic and a conversion gap you can measure, we want to talk about what closing that gap is worth to your revenue.
Who This Is NOT For
Businesses That Should Not Prioritise CRO Right Now
Sites with low monthly traffic. CRO requires enough sessions to detect a real signal — as a working rule of thumb, a few hundred visits per month is rarely enough to distinguish a genuine uplift from noise. Below that threshold, a change that looks like a win is often noise with a story attached. Invest in traffic acquisition first — then optimise.
Brands Expecting CRO to Compensate for a Broken Product
If reviews are negative and returns are high, improving the checkout flow will only accelerate dissatisfaction. CRO cannot fix a fulfilment problem or a product-market fit gap. Resolve the underlying issues before optimising the acquisition funnel.
Teams That Cannot Implement Changes
CRO findings are only as valuable as the speed at which they can be tested and deployed. If your development queue runs months long and design decisions require three sign-offs, A/B testing will produce insights faster than they can be acted on. Fix the implementation process first.
Businesses Chasing a Benchmark Rather Than a Business Outcome
A lower conversion rate at high margin often beats a higher rate on a thin-margin product. Conversion rate is a means to revenue, not an end in itself. If you are optimising to hit a benchmark number rather than to improve profit, you are solving the wrong problem.
Ready to know your real number? Start with A/B testing or talk to us about a full CRO audit that maps your current rate against the benchmarks that actually apply to your sector.
Frequently Asked Questions
What is the average conversion rate for South African ecommerce stores?
South African ecommerce stores averaged around 1.5% purchase conversion in 2024, comparable to the global ecommerce average of 1.6% recorded by Statista. The more telling number is SA cart abandonment, which runs at 83–84% — roughly 13 percentage points above the global average of 70% — indicating the gap is concentrated at checkout rather than earlier in the funnel.
What is a good conversion rate for a B2B professional services website in South Africa?
For professional services sites targeting warm, relevant traffic, a meaningful uplift in lead form conversion rate is achievable — global benchmarks for legal, finance, and professional services lead conversions range from 6.1–7.9%, and a well-optimised SA professional services page on relevant traffic has room to approach those levels. Cold paid traffic from Meta or display typically converts well below warm-traffic benchmarks for this sector.
Why is South Africa's cart abandonment rate higher than the global average?
SA cart abandonment runs 13+ percentage points above the global average of 70% because of three structural factors: payment trust anxiety (SA shoppers are more cautious about card fraud and expect to see familiar payment brands at checkout), limited payment method variety (only offering card excludes a large portion of debit-card-first shoppers), and mobile checkout friction on variable-speed data connections. Each of these is solvable — see the cart abandonment South Africa guide for step-by-step fixes.
Which marketing channel has the highest conversion rate in South Africa?
Globally, paid search (Google Ads) and AI referral traffic from tools like ChatGPT and Perplexity deliver the highest conversion rates — 5.4% and 5.8% respectively — because visitors arrive with explicit intent already formed. Email marketing tracks equally high at 4.9% for warm lists. Paid social (Meta, LinkedIn) converts at 2.11%, reflecting the interruption-based nature of social media discovery. SA-specific Google Ads conversion data is covered in the Google Ads benchmarks South Africa post.
How many visitors do I need before a conversion rate test is meaningful?
As a working rule of thumb, most A/B tests need enough sessions to detect a meaningful difference at 95% confidence — typically several hundred conversions per variant, not just visitors. Sites under a few hundred sessions per month should prioritise traffic growth before conversion testing. The practical floor is different for every test depending on your baseline rate and the size of lift you are trying to detect. See the full guide to A/B testing in South Africa for sample size planning.
Know Your Number. Close the Gap.
Growth Pulse Media benchmarks your site's actual conversion rate against your sector — not a generic average — then builds a prioritised fix list based on SA consumer behaviour, mobile-first checkout realities, and the trust dynamics of your specific market. We work with PayFast, Peach Payments, Ozow, and Yoco integrations, and we understand why SA shoppers behave differently at checkout than global averages suggest they should.
No obligation — we will get back to you within 24 hours with a clear view of where your site stands and what moving it one percentage point in conversion is worth in annual revenue.
