
 Add to Preferred Sources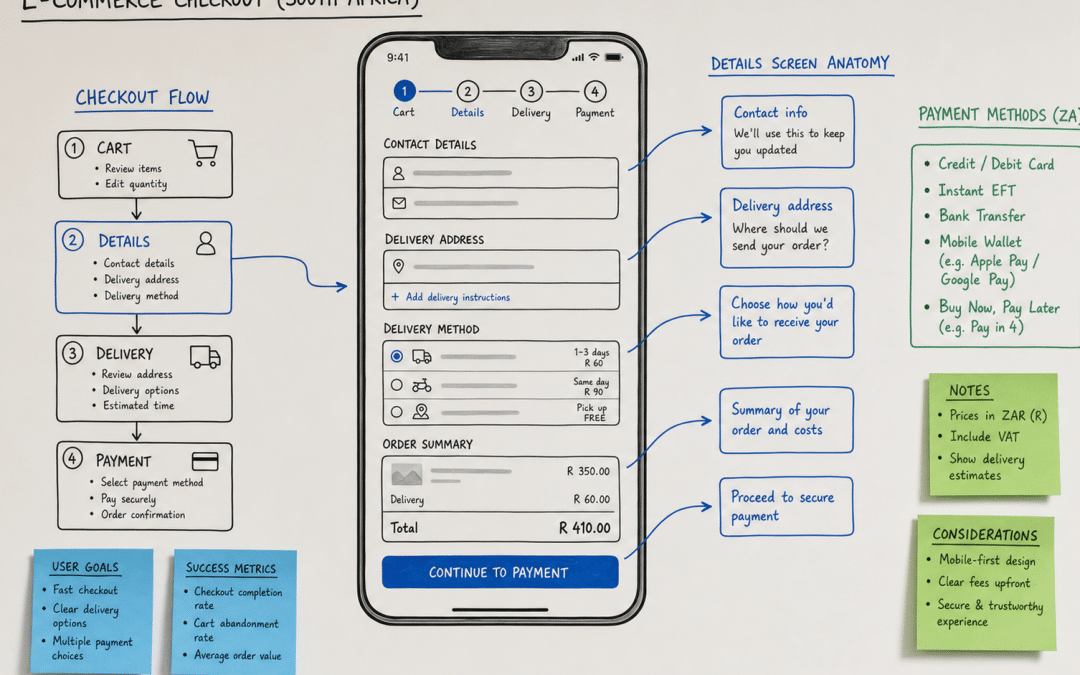
CRO for ecommerce in South Africa is mostly a checkout problem, not a traffic problem: local stores add to cart on a healthy 9.4–10% of visits, then lose 83.5–84.5% of those carts before payment completes. That is well above the global norm, it is concentrated at a single stage, and it is fixable — which makes it the highest-value work available to most SA stores, following the same discipline as our broader CRO guide for South African businesses.
For context on the gap: Baymard Institute puts the global average at 70.22% from a meta-analysis of 50 studies. South African stores are losing roughly fourteen percentage points more of their carts than the worldwide benchmark, and that difference is not explained by traffic quality.
Quick Answer
South African ecommerce stores abandon carts at 83.5–84.5%, above Baymard’s global average of 70.22% and Dynamic Yield’s 77.81%. CRO for ecommerce here means fixing checkout and payment-choice friction specifically, not buying more traffic. Offering three or more local payment methods is linked to up to 25% higher checkout conversion in South African benchmarks.
Not sure where your checkout is leaking sales?
Get a straightforward review of your store’s cart-to-checkout flow before you spend more on traffic.
How does South Africa’s cart abandonment compare to global norms?
South African abandonment of 83.5–84.5% sits above Baymard’s 70.22% cross-industry average and above the 67–76% band typical of mainstream global verticals.
Baymard’s running average has held in the high-60s to low-70s for more than a decade, which is precisely why it works as a stable benchmark rather than a single-year snapshot. Dynamic Yield’s rolling twelve-month measurement across more than 200 million monthly users puts abandonment higher, at 77.81%. Mainstream verticals — apparel, beauty, home, electronics — cluster between 67% and 76%.
South Africa recorded 83.5% in 2024 and 84.0–84.5% in 2025, against an add-to-cart rate of 9.4–10%. That specific combination is the diagnostic worth acting on: interest is being generated, and then lost after the shopper has already signalled intent. It is a far more precise problem statement than “why don’t more people buy”, and it means CRO for ecommerce here has a much shorter list of things to fix.
| Benchmark | Cart abandonment rate | What it tells you |
|---|---|---|
| Global average (Baymard, 50-study meta-analysis) | 70.22% | The stable long-run reference point |
| Global rolling 12-month (Dynamic Yield, 200M+ users) | 77.81% | A higher, more recent live-traffic measure |
| Mainstream global verticals | 67–76% | Typical range for comparable stores |
| South Africa, 2024 | 83.5% | Above every global reference above |
| South Africa, 2025 | 84.0–84.5% | The gap widened rather than closed |
SA figures sit above the global average and above the typical mainstream-vertical range in both years measured.
Key Insight
Checkout complexity is one of the few documented, fixable abandonment causes — nearly one in five shoppers who abandon cite a checkout that was too long or complicated.
Why do South African shoppers abandon carts before paying?
Card-only checkout is the single biggest mistake local stores make, because it excludes shoppers who distrust entering card details online or who prefer EFT, wallets or instalment options.
Mobile dominates the local market: over 77% of South Africans shop online via mobile, mobile-first shoppers generated 71.42% of B2C transactions in 2025, and mobile sessions run roughly 40% shorter than desktop sessions. Globally, smartphones drove about 78% of retail visits and 70% of orders in Q3 2025 — the same shift, more compressed here.
Those two facts compound. A shopper on a shorter mobile session has less patience to work around a checkout that does not offer their preferred payment method. Where a desktop user might open a new tab to arrange an EFT, a mobile user closes the tab.
What this looks like in practice: a store accepts cards only. A shopper who prefers Instant EFT reaches the payment step, finds no option, and leaves. The analytics record an abandoned cart, and the store concludes it has a “trust problem” and redesigns the product page — fixing something that was never broken.
The alternative: the same store adds Instant EFT and a BNPL option, and segments abandonment by payment step. The drop-off moves, and the next test is aimed at whatever the data now points to rather than at a guess.
That is a payment-page problem far more than a design one — our guide to checkout optimisation in South Africa covers the specific fixes. If the loss is happening earlier, at the cart rather than the payment step, our dedicated guide on cart abandonment in South Africa breaks those causes down separately.
Key Insight
Short mobile sessions and limited payment choice compound each other — a shopper with less time abandons faster when their preferred payment option is missing.
Which payment methods actually lift South African checkout conversion?
Offering three or more local payment options is linked to up to 25% higher checkout conversion in South African benchmarks.
Payment breadth, not processing cost, is what local benchmarks tie to conversion. Merchants offering at least three methods see up to 25% higher checkout conversion. Buy Now Pay Later doubled from 3% to 6% of transaction volume between 2024 and 2025 — a strong signal that it is worth testing rather than assuming local shoppers do not want it.
Instant EFT providers such as Ozow facilitate an immediate bank-to-bank transfer between merchant and customer accounts. These payments are irreversible, meaning no chargebacks, and processing occurs in a PCI DSS Level 1-compliant environment. For a merchant, that is a materially different risk profile to card payments; for a shopper who does not want to type card details into a site they have not used before, it removes the objection entirely.
| Payment method | Key characteristic in South Africa | Worth testing when |
|---|---|---|
| Instant EFT (e.g. Ozow) | Immediate bank-to-bank transfer, irreversible, no chargebacks, PCI DSS Level 1 | Card-only today, or chargebacks are a cost centre |
| Card only | Flagged as the single biggest checkout mistake SA stores make | Never as the sole option |
| BNPL (PayJustNow, Payflex, Mobicred) | Doubled from 3% to 6% of transaction volume, 2024–2025 | Average order value is high enough to matter |
| Three or more methods combined | Linked to up to 25% higher checkout conversion | Almost always the first structural test |
Payment breadth, not just processing cost, is what local benchmarks tie to conversion lift.
Key Insight
Payment-method breadth is a South Africa-specific CRO lever, not a generic “add more options” tactic borrowed from card-centric markets.
Weighing up payment methods against a full redesign?
Talk through which funnel stage is genuinely worth testing first for your store.
What does a realistic South African ecommerce funnel look like?
A typical local store adds to cart on 9.4–10% of visits, loses 83.5–84.5% of those carts, and averages around US$104 per order.
Global visit-to-purchase conversion sits near 1.6% according to Statista, which is a useful sanity check on the top of the funnel. The point of the table below is not to grade your store against a pass mark, but to show where the loss concentrates.
| Metric | 2024 | 2025 |
|---|---|---|
| Add-to-cart rate | 9.4% | 9.5–10.0% |
| Cart abandonment rate | 83.5% | 84.0–84.5% |
| Average order value | US$104 | Not reported in this dataset |
| Discount rate | 9.0% | Not reported in this dataset |
| Return rate | 6.3% | Not reported in this dataset |
Directional baselines for your own store, not pass/fail targets. Average order value is reported in US dollars in the source dataset.
Read the first two rows together and the priority becomes obvious. Doubling the add-to-cart rate from 9.4% to 19% would be an extraordinary achievement requiring wholesale changes to product pages, pricing and merchandising. Cutting abandonment from 84% to the 70% global average requires changes at one stage of the funnel — and delivers considerably more revenue.
Key Insight
A 9–10% add-to-cart rate is not the problem South African stores need to solve; the 83.5–84.5% lost after that point is.
Where should CRO effort start for an existing store?
Start with checkout and payment-method testing before redesigning product pages, because that is where the documented South Africa-specific gap sits.
Structured testing rather than guesswork is what separates CRO for ecommerce from a redesign. Our guide to A/B testing in South Africa covers the sample-size mathematics for stores with modest traffic, which matters a great deal if your monthly cart starts are in the low hundreds — at that volume, most “wins” are noise.
Payment friction is not only about which methods you accept. It is also whether the shopper trusts the page enough to enter details at all. Our guide to trust signals for South African buyers covers what belongs near the payment button, and the two problems are usually worth diagnosing together.
A workable order of work looks like this. First, instrument the funnel properly so cart, checkout and payment steps are separately measurable — without that, everything afterwards is opinion. Second, add payment breadth, since it is the change with the clearest local evidence behind it. Third, simplify the checkout itself: field count, guest checkout, and visible delivery and returns terms. Only then is it worth touching product pages.
The pace of growth raises the stakes. Online retail grew 35% in 2024 to reach R96-billion, representing 8% of total retail sales, and continued at an annualised 38% through 2025, while physical retail grew just 2.5% in 2024 and 1.6% by mid-2025. A percentage point of checkout conversion is worth more each year, simply because the channel underneath it is expanding.
Key Insight
Every point of checkout conversion recovered is worth more this year than last, because online retail is growing many times faster than physical retail.
The Bottom Line
South Africa’s ecommerce problem is not traffic or interest — add-to-cart rates are reasonable and the market is growing quickly. The problem is what happens next: 83.5–84.5% of carts do not convert, well above global norms, and the loss concentrates at checkout and payment choice.
CRO for ecommerce here starts with payment breadth and checkout simplification, tested in order of documented impact rather than redesigned all at once. Measure the funnel first, add payment options second, simplify the checkout third. The market is growing fast enough that this is worth doing now rather than eventually.
The GPM Difference
South Africa’s cart-abandonment problem is checkout- and payment-specific rather than generic, so our approach maps your funnel against local benchmarks before anyone tests a button colour.
Growth Pulse Media is run by an operator, not an account manager. Dirk van Greuning built and scaled South African ecommerce businesses before founding GPM, which is why the advice here is costed in Rands, tested against the South African market, and measured in pipeline rather than impressions.
If you want Conversion Rate Optimisation South Africa handled by someone who has carried the same numbers you are carrying, that is the work we do.
Who This Is NOT For
Your store gets fewer than 500 sessions a month. At that volume a checkout test cannot separate a real improvement from ordinary variation, so any change we made would be guesswork dressed up as optimisation. Put the budget into traffic first.
Your payment stack is locked to a single processor and cannot change. Checkout CRO hits a ceiling fast when payment breadth is off the table, and payment breadth is the change with the clearest local evidence behind it.
There is no analytics or event tracking on the store. That has to be built before any test can be trusted. Treat it as a prerequisite, not an optional extra.
You want a visual redesign rather than a measured test programme. That is a design brief, and a legitimate one — but it is not conversion optimisation and should not be judged on conversion outcomes.
Losing sales specifically at the payment page?
We will map which checkout step is costing you the most South African shoppers.
Frequently Asked Questions
What is a good ecommerce conversion rate for a South African store?
Global visit-to-purchase conversion runs near 1.6% according to Statista. Published South African conversion figures vary considerably across sources, so it is more useful to track your own add-to-cart and abandonment trend against the benchmarks in this guide than to chase a single external number.
Why does South Africa have higher cart abandonment than the global average?
South African abandonment sits at 83.5% for 2024 and 84.0–84.5% for 2025, above Baymard’s global average of 70.22% and Dynamic Yield’s 77.81%. Mainstream global verticals cluster between 67% and 76%, so South Africa sits above typical ecommerce rather than merely above a headline average.
Does adding Instant EFT actually reduce abandonment?
Instant EFT providers such as Ozow process an immediate bank-to-bank transfer that is irreversible with no chargebacks, in a PCI DSS Level 1-compliant environment. South African merchants offering three or more payment methods see up to 25% higher checkout conversion in local benchmarks, so adding it is a well-evidenced test.
How big a factor is mobile in South African checkout abandonment?
Significant. Over 77% of South Africans shop via mobile, mobile-first shoppers made 71.42% of 2025 B2C transactions, and mobile sessions run about 40% shorter than desktop. That leaves considerably less patience for a slow or complicated checkout.
Is Buy Now Pay Later worth adding to a South African checkout?
BNPL usage doubled from 3% to 6% of South African transaction volume between 2024 and 2025, which makes it a reasonable test candidate alongside card and EFT — particularly where average order value is high enough for instalments to change the decision.
Should I focus on more traffic or fixing checkout first?
Checkout first. South Africa’s add-to-cart rate of 9.4–10% is already reasonable, while 83.5–84.5% of those carts are lost afterwards. That points to checkout and payment fixes as the stage with the largest concentrated, documented loss.
Most South African businesses we speak to have been burned by an agency that reported on impressions while the pipeline stayed flat. That is the conversation we would rather start with.
Ready to see where your funnel is losing South African shoppers?
Book a no-obligation consultation and we will walk through your store’s numbers together. We reply within 24 hours.
