
 Add to Preferred Sources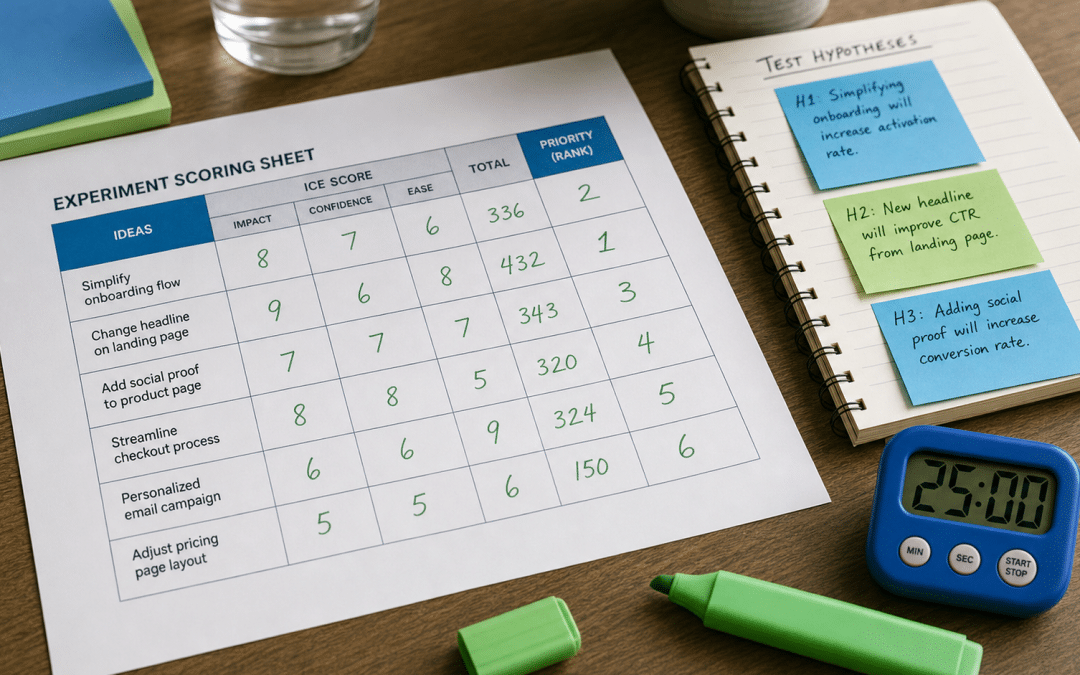
A marketing experiment backlog guide turns the question "what should we test next?" from a team debate into a five-second answer: look at the top card in your scored queue, assign an owner, and ship it. As part of a well-built digital strategy for South Africa, a properly maintained backlog replaces intuition with a repeatable learning system where every completed test informs the next.
Most South African marketing teams approach testing ad hoc — a new headline here, a button colour swap there — then struggle to show cumulative progress. The problem is rarely a shortage of ideas. It is the absence of a prioritised queue. Without a scored backlog, the loudest voice in the room decides what gets tested, high-effort low-return ideas crowd out quick wins, and learnings vanish when team members move on.
This guide covers the four fields every experiment card needs, how to compare ICE, PIE and RICE scoring, how to organise your test queue by funnel stage, and the five-stage workflow that takes an idea from sticky note to live test to an insight you can compound.
Quick Answer
A marketing experiment backlog guide is the central document that captures every pending test idea, assigns a priority score (ICE, PIE or RICE) to each one, and releases only the highest-ranked experiments into your live sprint. Start with a simple Google Sheet, four columns — Hypothesis, Primary Metric, Score, Owner — and at least 20 scored ideas before your first prioritised sprint. The discipline of scoring consistently, archiving every result, and rescoring quarterly counts for more than your choice of tool or scoring framework.
On This Page
No idea which experiments deserve the first sprint?
Share your current test ideas and we'll run a live ICE-score session to show you which ones to ship first.
Score my experiment ideasWhat Is a Marketing Experiment Backlog Guide?
A marketing experiment backlog is a scored, prioritised list of every pending test your team has identified — structured so the next experiment to run is always obvious. It is the growth equivalent of a product backlog: a living document, not a filing cabinet. Unlike a simple idea list, every card in the backlog carries a score, an owner, a hypothesis, and a success criterion before the team touches it.
The backlog's job is not to capture all your ideas. It is to prevent poor ideas from consuming the same time and budget as strong ones. Research from Ronny Kohavi — who oversaw large-scale experimentation at Microsoft and Amazon — shows roughly one in three well-designed experiments produces a positive result. The other two either make no measurable difference or actively harm the metric you were improving. A scored backlog ensures you are running your best ideas, not a random selection. (AB Tasty — Interview with Ronny Kohavi)
The backlog connects directly to your marketing channel testing framework. Where the channel framework tells you which channels to include in your media mix, the experiment backlog decides which specific changes within those channels get tested first, in what order, and against what standard.
What Goes on Every Experiment Card
Each item in your marketing experiment backlog needs exactly four fields before it earns a place in the queue. Fewer fields and you lose context when the team revisits it two months later; more fields and the overhead kills the habit of keeping it updated.
| Field | What to Write | Example |
|---|---|---|
| Hypothesis | "Based on [insight], changing [X] to [Y] will increase [metric] because [reason]." | "Based on heat-map data showing users ignore the hero CTA, moving it above the fold will increase click-through rate because it removes a scroll barrier." |
| Primary Metric | One measurable outcome — not a list. Tie it to revenue or a direct revenue proxy. | Add-to-cart rate on the product page |
| Priority Score | ICE, PIE or RICE score (see below). Calculated before the card enters the queue. | ICE: 7.3 |
| Owner | The one person responsible for setup, monitoring and results write-up. One name, not a team. | Sipho (paid media lead) |
Useful additions: a "Stage" column (Acquisition, Activation, Retention) and a "Source" column noting where the idea came from — a heatmap, a customer interview, a competitor audit, or a data anomaly spotted in GA4. Tracking sources helps you see over time which research inputs produce the highest-scoring experiment ideas.
Key Takeaway
If an experiment idea cannot be expressed as a complete hypothesis with a single primary metric, it is not ready for the backlog yet. An unformed idea scores poorly and wastes the team's prioritisation time. Return it to the idea bank with a note on what research is missing.
How to Score Your Backlog: ICE, PIE and RICE Compared
The three most-used scoring frameworks for a marketing experiment backlog are ICE, PIE and RICE. All three produce a ranked list from similar inputs; they differ in what they measure and which team type each suits best. Picking one and applying it consistently will drive far more testing velocity than the choice of framework itself.
| Framework | Formula | Best For | Key Limitation |
|---|---|---|---|
| ICE | (Impact + Confidence + Ease) ÷ 3 | Small teams, early-stage programmes, fast weekly scoring sessions | Does not account for audience size — a high-ICE test on a low-traffic page can still produce an inconclusive result |
| PIE | (Potential + Importance + Ease) ÷ 3 | CRO and A/B testing teams; places explicit weight on the page's traffic importance | Confidence is implicit — teams can over-score Potential without supporting data |
| RICE | (Reach × Impact × Confidence) ÷ Effort | Mature teams with reliable audience data; captures segment-size differences | Scoring Reach requires clean traffic data; adds overhead that slows early programmes |
ICE was created by Sean Ellis — who coined "growth hacking" — and was refined during his work at LogMeIn and Dropbox. PIE was developed by Chris Goward at WiderFunnel and is the default in most CRO practices. Both use a 1–10 scale for each dimension, averaged to produce the final score. (Growth Method — Prioritisation Frameworks Compared)
For most South African teams starting a marketing experiment backlog guide from scratch, ICE is the right choice — it takes roughly 30 minutes to score 20 ideas and requires no historical data. Move to RICE when you have reliable traffic segmentation and enough concurrent experiments to justify the extra scoring overhead.
A common working threshold: ideas scoring below 6.0 on ICE are set aside without debate. Growth practitioners tracking ICE outcomes report this eliminates roughly 70% of low-value ideas before they drain planning time. Adjust the threshold to your backlog size — a thin backlog needs a lower cut-off than one with 40 or more entries.
Organising Experiments by Funnel Stage
Structuring your experiment backlog by AARRR funnel stage — Awareness, Acquisition, Activation, Revenue, Retention, Referral — prevents the common pattern of over-testing at one stage (usually Acquisition) while ignoring the others (usually Retention). It also helps you match the right success metric to the right experiment type before the score is calculated.
| Stage | Typical Experiments | Primary Metric |
|---|---|---|
| Awareness | Ad creative formats, headline variants, audience targeting changes, video vs static | CPM, reach, share of voice |
| Acquisition | Landing page headline, form length, CTA button copy, ad-to-page message match | Cost per lead, conversion rate |
| Activation | Onboarding email sequence, welcome flow, first-purchase discount trigger, in-app prompt | Activation rate, first order rate |
| Revenue | Pricing page layout, upsell placement, checkout flow, abandoned cart sequence timing | Average order value, revenue per session |
| Retention | Re-engagement email timing, loyalty offer structure, NPS follow-up sequence | Repeat purchase rate, churn rate |
| Referral | Referral incentive framing, share prompt placement, WhatsApp referral mechanic | Referral rate, referred conversion rate |
Tracking your marketing goals vs KPIs at the funnel-stage level makes backlog gaps visible immediately. If three-quarters of your scored experiments sit at the Acquisition stage, the queue is not balanced — and your overall growth rate will be constrained by the stages you are ignoring. Aim for at least one live experiment at each stage of the funnel you actively manage.
The Backlog Workflow: From Idea to Learning Archive
A well-run marketing experiment backlog guide operates through five stages. Every idea enters at Stage 1 and exits at Stage 5 — nothing sits in limbo, and nothing gets deleted without a recorded reason.
Stage 1 — Idea Bank. Any team member can add a rough idea here. No scoring required. The Idea Bank is the messy inbox, not the backlog. Schedule a weekly 30-minute session — 10 minutes of individual scoring, 10 minutes of group discussion, 10 minutes of ranking — to move the strongest ideas forward.
Stage 2 — Scored Queue. Every card here has a complete hypothesis, a primary metric, a priority score and an assigned owner. The queue is sorted by score, highest first. The top card is the next experiment to run. Move a card to Stage 3 when the team has capacity and the card has everything needed to brief development or media.
Stage 3 — Live. The experiment is running. Define the success threshold, failure threshold and minimum duration before the test launches — not after you see the first day's numbers. Minimum duration as a working guideline: two weeks for most SA businesses; four weeks if weekly traffic patterns are uneven. Use GA4 for South African businesses to segment results by device, channel and session quality before drawing conclusions.
Stage 4 — Analysis. After the test closes, the owner writes a one-paragraph results note: what happened, why it might have happened, and what the team should test next as a result. Statistical significance standard: p < 0.05 (95% confidence) and at least 80% statistical power. If the test did not reach significance, archive it as "inconclusive" with the sample size and duration on record — not as a failure.
Stage 5 — Learning Archive. Every completed experiment lives here permanently. The archive is your team's institutional memory. Before any new experiment enters Stage 2, the owner checks the archive for prior tests on the same element. Re-testing something that already failed — without a new hypothesis — is the most common source of backlog waste.
Key Takeaway
Nothing damages an experiment programme faster than reading results before the test is complete. Set the minimum duration and sample target before you launch. Block your calendar for the result date. A number on Day 3 is noise with a story attached — calling it a result is how most marketing teams end up running the same test four times and getting a different answer each time.
Your test results evaporating before the team can use them?
Send us your current tracking setup and we'll show you exactly where learnings are slipping through before they can compound into real growth.
Fix my experiment trackingFour Considerations for South African Marketing Teams
Most marketing experiment backlog advice is written for US or EU audience sizes and stable infrastructure. South African teams need four practical adjustments.
1. Small audiences need longer test durations. South Africa's digital advertising market is growing fast — Research and Markets projects it at US$2.40 billion in 2026, up 12.2% year-on-year — but individual brand audiences remain modest by global standards. A single landing page handling 800 sessions per month may need six to eight weeks to produce a statistically significant result on a 5% conversion-rate change. Factor this into your scoring: a high-ICE idea on a low-traffic page carries a lower Confidence score in practice, even if the underlying hypothesis is sound. The first-party data tracking strategy that feeds your backlog needs to surface page-level traffic before you score, not after.
2. Load-shedding distorts test windows. Stage 4 and 5 load-shedding pushes consumer behaviour online at unusual hours, compresses traffic into narrow windows, and suppresses mobile conversions at other times. If a critical test period coincides with a declared schedule, archive the experiment with a distortion note and re-queue it. Do not call a result from a traffic sample you know was affected by infrastructure interruption.
3. POPIA shapes how you segment experiments. Email experiments that segment by personal attribute — product history, location, declared preference — involve processing personal data. Under POPIA, that processing requires a lawful basis: legitimate interest and contractual necessity are common grounds alongside consent. The digital advertising spend in South Africa is increasingly data-driven, and the teams winning that spend are the ones whose data practices hold up under scrutiny. A POPIA pre-flight check is not a blocker; it is a one-hour review before your experiment card reaches Stage 3.
4. Budget reality raises the cost of a poorly scored experiment. SA SMEs and mid-market businesses typically allocate between 5% and 12% of revenue to digital marketing. For most, there is no separate experimentation budget — tests compete directly with live campaign spend for developer time and media rand. This makes ICE scoring more important, not less. Experiment ideas that run inside Google Tag Manager without a development build should jump the queue over high-impact ideas requiring a two-week technical implementation.
Common Backlog Mistakes SA Teams Make
Group dynamics inflate Ease scores (optimists set the tone) and suppress Confidence scores (the most vocal sceptic wins). Score individually first, then compare and reconcile outliers in discussion.
Overlapping tests contaminate both results. If one experiment changes the headline and another changes the CTA at the same time, you cannot isolate which change caused the movement. Queue experiments sequentially on the same element or audience — never overlap them.
An inconclusive result with sample size, duration and a note on what you would do differently is a permanent institutional asset. It prevents the team from re-running the same test on instinct six months later and calling the conflicting result a breakthrough.
Traffic patterns shift, new qualitative data arrives, and completed tests change your assumptions about related hypotheses. A backlog scored in January may have the wrong ideas at the top by April. Schedule a quarterly re-score session — for 20 ideas, it takes roughly an hour.
Why South African Businesses Choose Growth Pulse Media for Experiment Strategy
Growth Pulse Media's practice grew out of building and scaling a South African ecommerce business — which means our team has run the experiments, paid for the ones that failed, and built the logging discipline that makes future tests cheaper. Our digital strategy service combines GA4, Google Tag Manager, Meta Ads and HubSpot into a single experiment management layer, so the data you need to score your next experiment is already in one place when you need it.
We maintain a limited client roster by design. Senior strategists manage your experiment backlog directly — not a junior account manager operating from a template. Every experiment we run generates a written results note added to a shared archive, so your team's institutional knowledge does not disappear when a staff member moves on.
Our knowledge of the South African market — audience sizes by category, load-shedding traffic distortion patterns, POPIA processing requirements, platform nuances across Meta and Google — means your Confidence scores are calibrated against SA realities, not global benchmarks that assume audiences your brand may take years to build. The IAB South Africa — the industry body representing over 150 SA agencies, publishers and adtech companies — sets the measurement standards that inform how we benchmark experiment results in a local context that global frameworks miss.
Who This Is NOT For
If your organisation cannot commit to leaving an experiment running for the full planned duration — regardless of what interim numbers look like — a scored backlog will not help you. The test discipline is a prerequisite, not something the system provides.
If your key pages receive only a handful of sessions per week, most experiments will close inconclusive before the score is meaningful. Fix traffic first. A backlog of well-scored experiments is wasted on pages too thin to settle a result.
Conflicts of interest in experiment analysis corrupt results. The person who built and launched the test should not be the sole arbiter of when it is complete. Even a single peer review before a result is called changes the outcome quality significantly.
An experiment backlog is an ongoing operating system, not a project deliverable. If you need one campaign to reach its targets by end of month, a backlog setup is not the right starting point. Run one clean single-hypothesis test first, then build the system once you have the appetite to run more.
Not sure if your backlog is solving the right problem?
Book a 30-minute digital strategy session — we'll score your top five experiment ideas together and show you which one to ship first.
Book a strategy sessionFrequently Asked Questions
What is a marketing experiment backlog?
A marketing experiment backlog is a scored, prioritised list of every pending test idea your team has identified — structured so the next experiment to run is always the top card in the queue. Unlike a simple idea list, every card carries a hypothesis, a primary metric, a priority score and an assigned owner before it enters the queue. The backlog replaces recurring 'what should we test?' debates with a clear, consistent answer.
What is the difference between ICE and PIE scoring?
Both ICE and PIE use a three-factor, 1–10 average score. ICE measures Impact, Confidence and Ease — it asks how likely an experiment is to work. PIE measures Potential, Importance and Ease — it asks how much uplift a page could realistically achieve and how much traffic that page carries. ICE suits early-stage teams and broad growth experiments; PIE is more common in CRO and A/B testing where page importance is a key input to the decision.
How many experiments should I have in my backlog?
As a practical starting point, score at least 20 ideas before your first prioritised sprint — this ensures the top-ranked card is genuinely the best available option rather than the only option. An active South African marketing team typically maintains a working queue large enough to sustain two or three months of testing velocity without running dry. A queue that outgrows your team's actual testing capacity rarely gets worked through, which usually signals the scoring threshold needs raising to keep only the strongest ideas in.
How long should a marketing experiment run before I read the results?
A minimum of two weeks for most South African businesses — ideally four weeks if weekly traffic patterns are uneven. Ending a test early because early numbers look promising is the most common source of false positives in marketing experimentation. Set your minimum duration and target sample size before you launch, and only check results on the agreed end date. Most industry standards require 95% confidence and at least 80% statistical power before a result is called.
Do I need special software to manage a marketing experiment backlog?
No. A well-structured Google Sheet with four columns — Hypothesis, Primary Metric, Score and Owner — handles most experiment backlogs for SA teams. The discipline of scoring, reviewing and archiving every experiment counts for far more than the tool. Dedicated platforms such as VWO, AB Tasty or Convert add real value when you reach a testing velocity that a spreadsheet cannot manage cleanly, but that is a later-stage problem most SA teams have not yet reached.
Ready to run experiments that actually compound?
Growth Pulse Media builds and manages experiment backlogs for South African marketing teams — using GA4, Google Tag Manager, Meta Ads and HubSpot, with POPIA-aligned data practices and SA-calibrated scoring. We will have your first prioritised queue ready within a week, with results notes that build institutional knowledge from test one.
No obligation — we'll get back to you within 24 hours.
Start the conversation